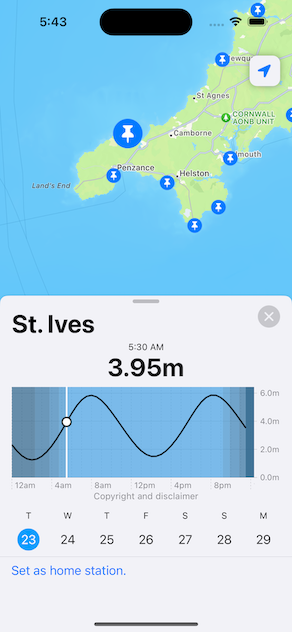
I’ve got Home Tide to a point where you can very quickly get a handle on what’s happening with the day’s tides by tapping on the map:

This view tells you:
- How high is the tide right now?
- Is the tide going in or out?
- When are high and low tides?
- Which parts of the tide cycle will be in daylight?
So you can answer questions like:
- When is the surf going to be working?
- When is the best time for a swim?
- When is the best time for a walk along the beach?
- When is the best time to paddleboard?
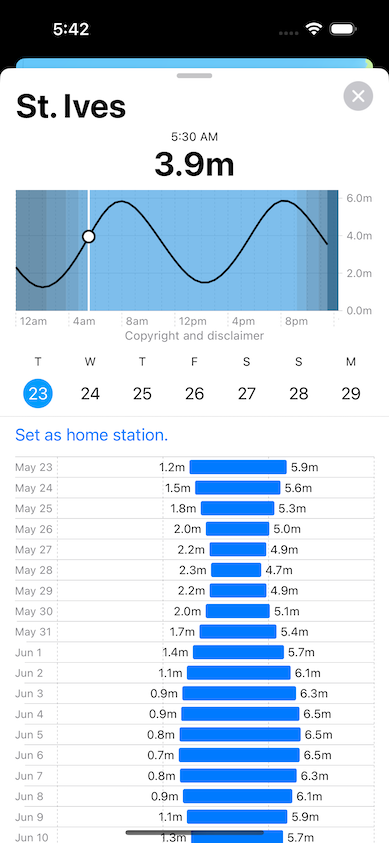
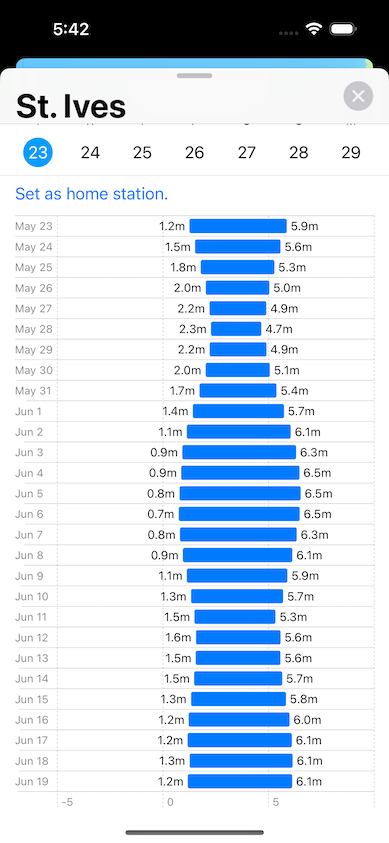
Lately I’ve been thinking about how best to visualise the next 28 days of the tide cycle. This is what I’ve come up with:
The idea of this view - which owes an obvious debt of inspiration to Dark Sky - is to tell you:
- When are spring tides?
- When are neap tides?
- How much water will there be on any given day?
So you can answer questions like:
- When will there be enough water to launch my canoe?
- When is a good day to paddle across the harbour?
- How fast will the tide be changing today?
- What day will have the fastest tidal currents?
I can’t decide if it’s useful or just pretty. If you’ve got an opinion please let me know.

